
Ask any planner or operations leader whether they'd like to know exactly how well their shop is executing to schedule, and the answer is always yes. Schedule adherence is one of those numbers everybody wants on the wall: what did we say we'd finish, what did we actually finish, and how close were the two?
Here's the catch that's held people back for years. Wanting the number and being able to see it are two very different things. For most manufacturers, schedule adherence has been just out of reach. Not because the data didn't exist, but because pulling it together into something you could actually trust and act on was more effort than anyone had time for. So the number most teams chase after is the one they've never really been able to hold.
Why it was always so hard to get
To measure adherence honestly, you need to compare what actually happened against the plan you originally committed to: the scheduled start and finish dates for your jobs and operations. But those original dates are a moving target. Every time APS or the scheduler runs, the plan shifts to reflect the new reality. Miss the moment, and the plan you were supposed to measure against is already gone, overwritten by the next one.
That's the quiet reason schedule adherence has stayed a "someday" metric for so long. It's not that people didn't care about it. It's that reliably capturing the original plan, holding onto it through every reschedule, and then lining actual execution up against it, day after day, at both the job and operation level, was genuinely difficult. Difficult enough that, for most shops, it simply didn't happen.
Now the number is just there
This is what changes with Fact-Trak. Instead of inventing a way to reconstruct schedule adherence after the fact, Fact-Trak captures and preserves the original scheduled start and end dates for your jobs and operations, and keeps them even after APS or the scheduler reschedules the work. The baseline you need to measure against is protected automatically, so the number is there when you want it.
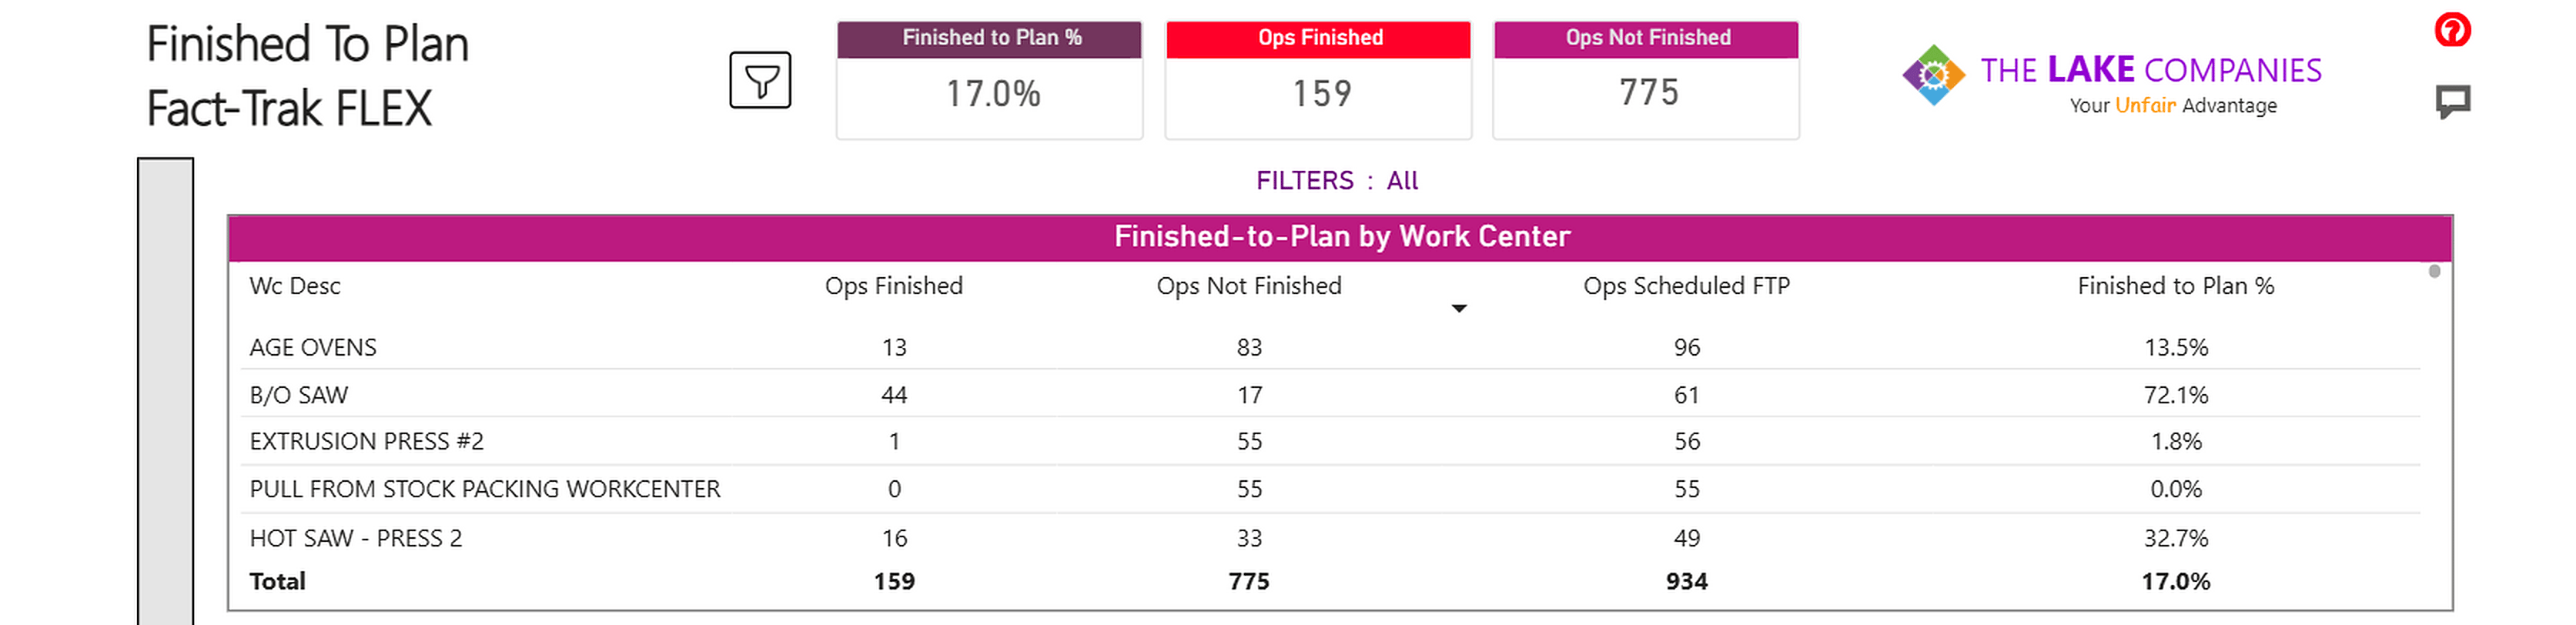
The top-level view: what you scheduled to finish versus what actually finished, with finished-to-plan percentage broken out by work center.
From there, you can finally see what you've been after. Whether jobs and operations started and finished as planned, and how early or late they landed against the original schedule. A daily view that compares the operations scheduled to finish on a given day against the ones that actually finished, the "operations finished to plan" number teams have always wanted and rarely gotten to see cleanly. And the ability to look at all of it at both the job level and the operation level, right alongside your other operational and planning metrics.
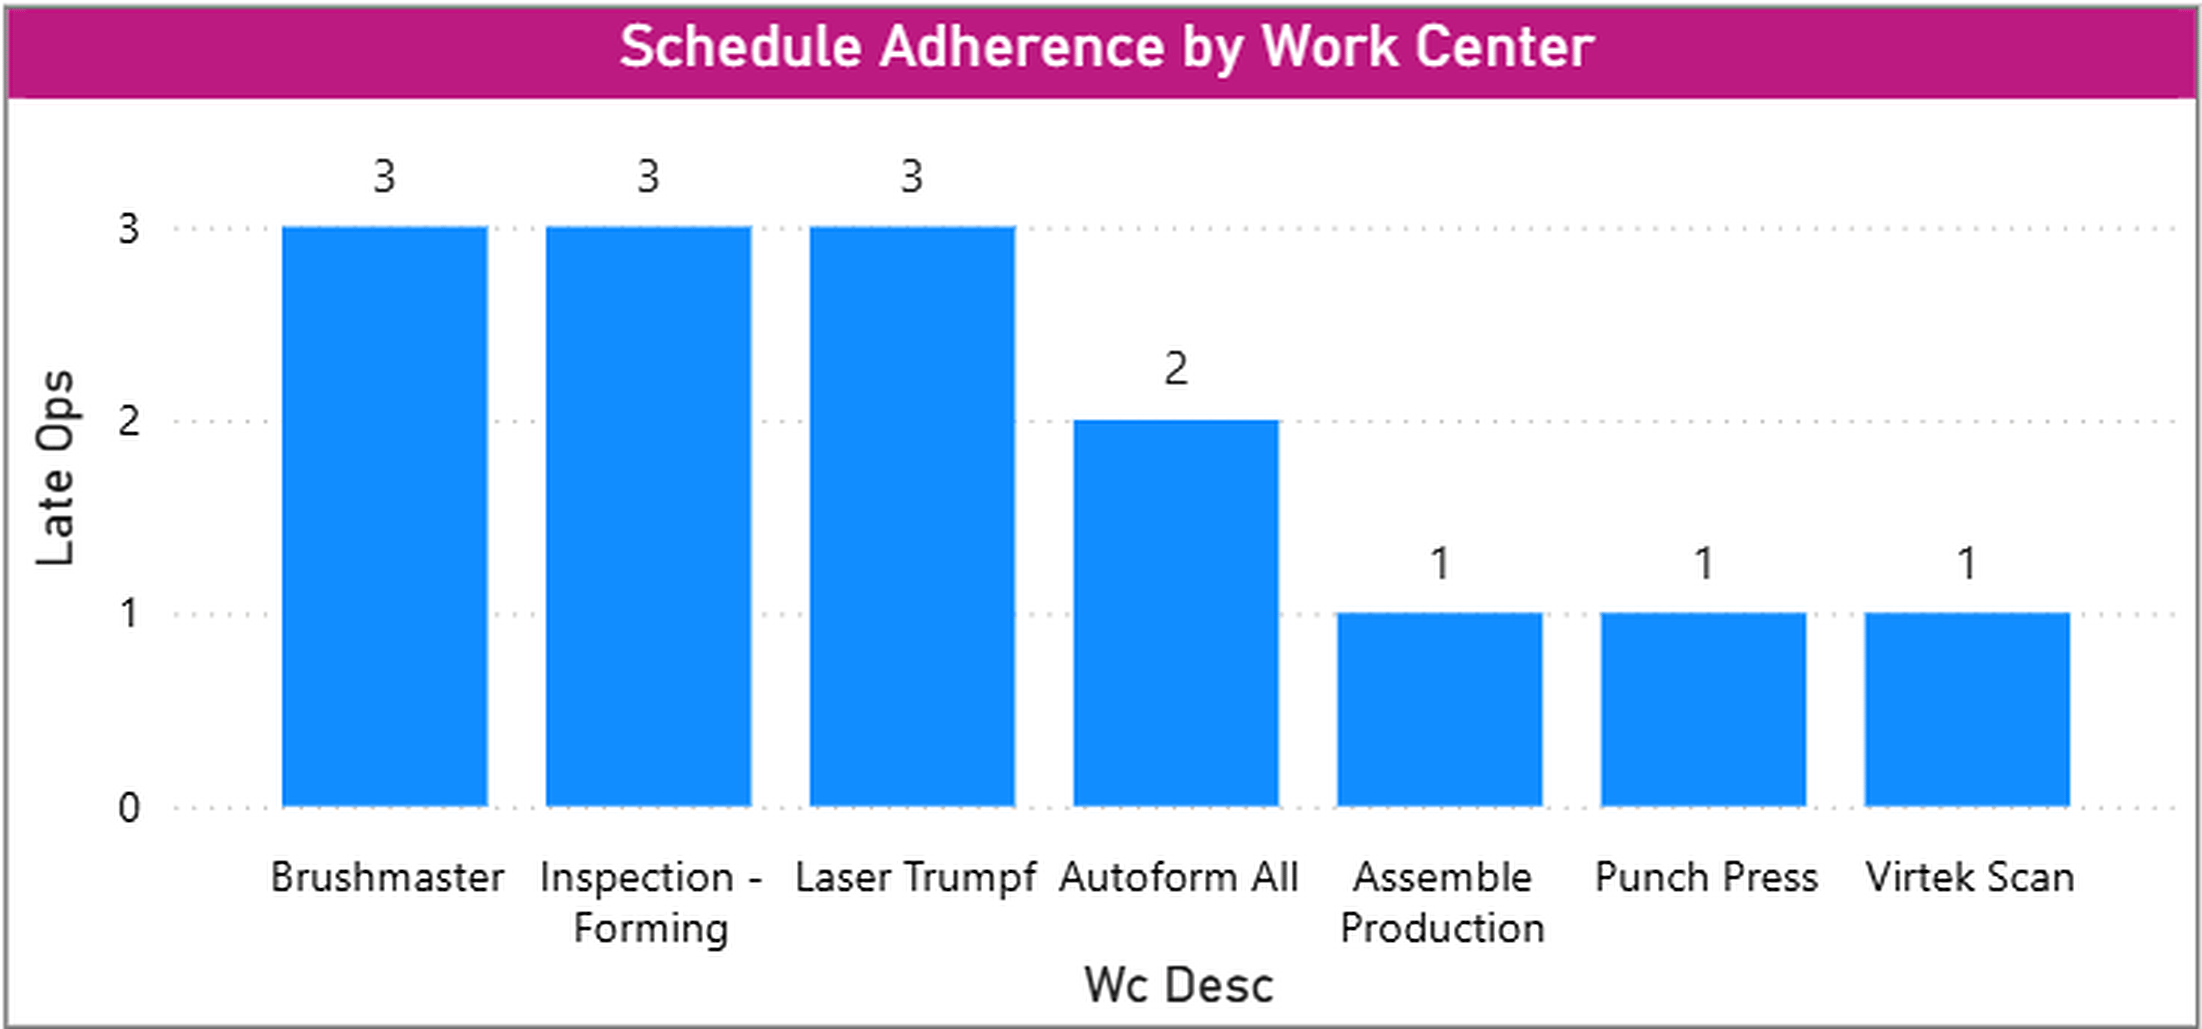
Adherence by work center at a glance, so the areas falling behind plan stand out immediately.
See it, then act on it
A number you can see is a number you can improve. Because adherence lives in Fact-Trak's BI reporting, you can slice it the way real investigation demands, by item, job, work center, resource group, product code, planner code, and date, and drill straight from the summary into the underlying jobs and operations driving it. When the number slips, you can see whether it's clustered on certain dates, certain work centers, or certain items, and go find out why.
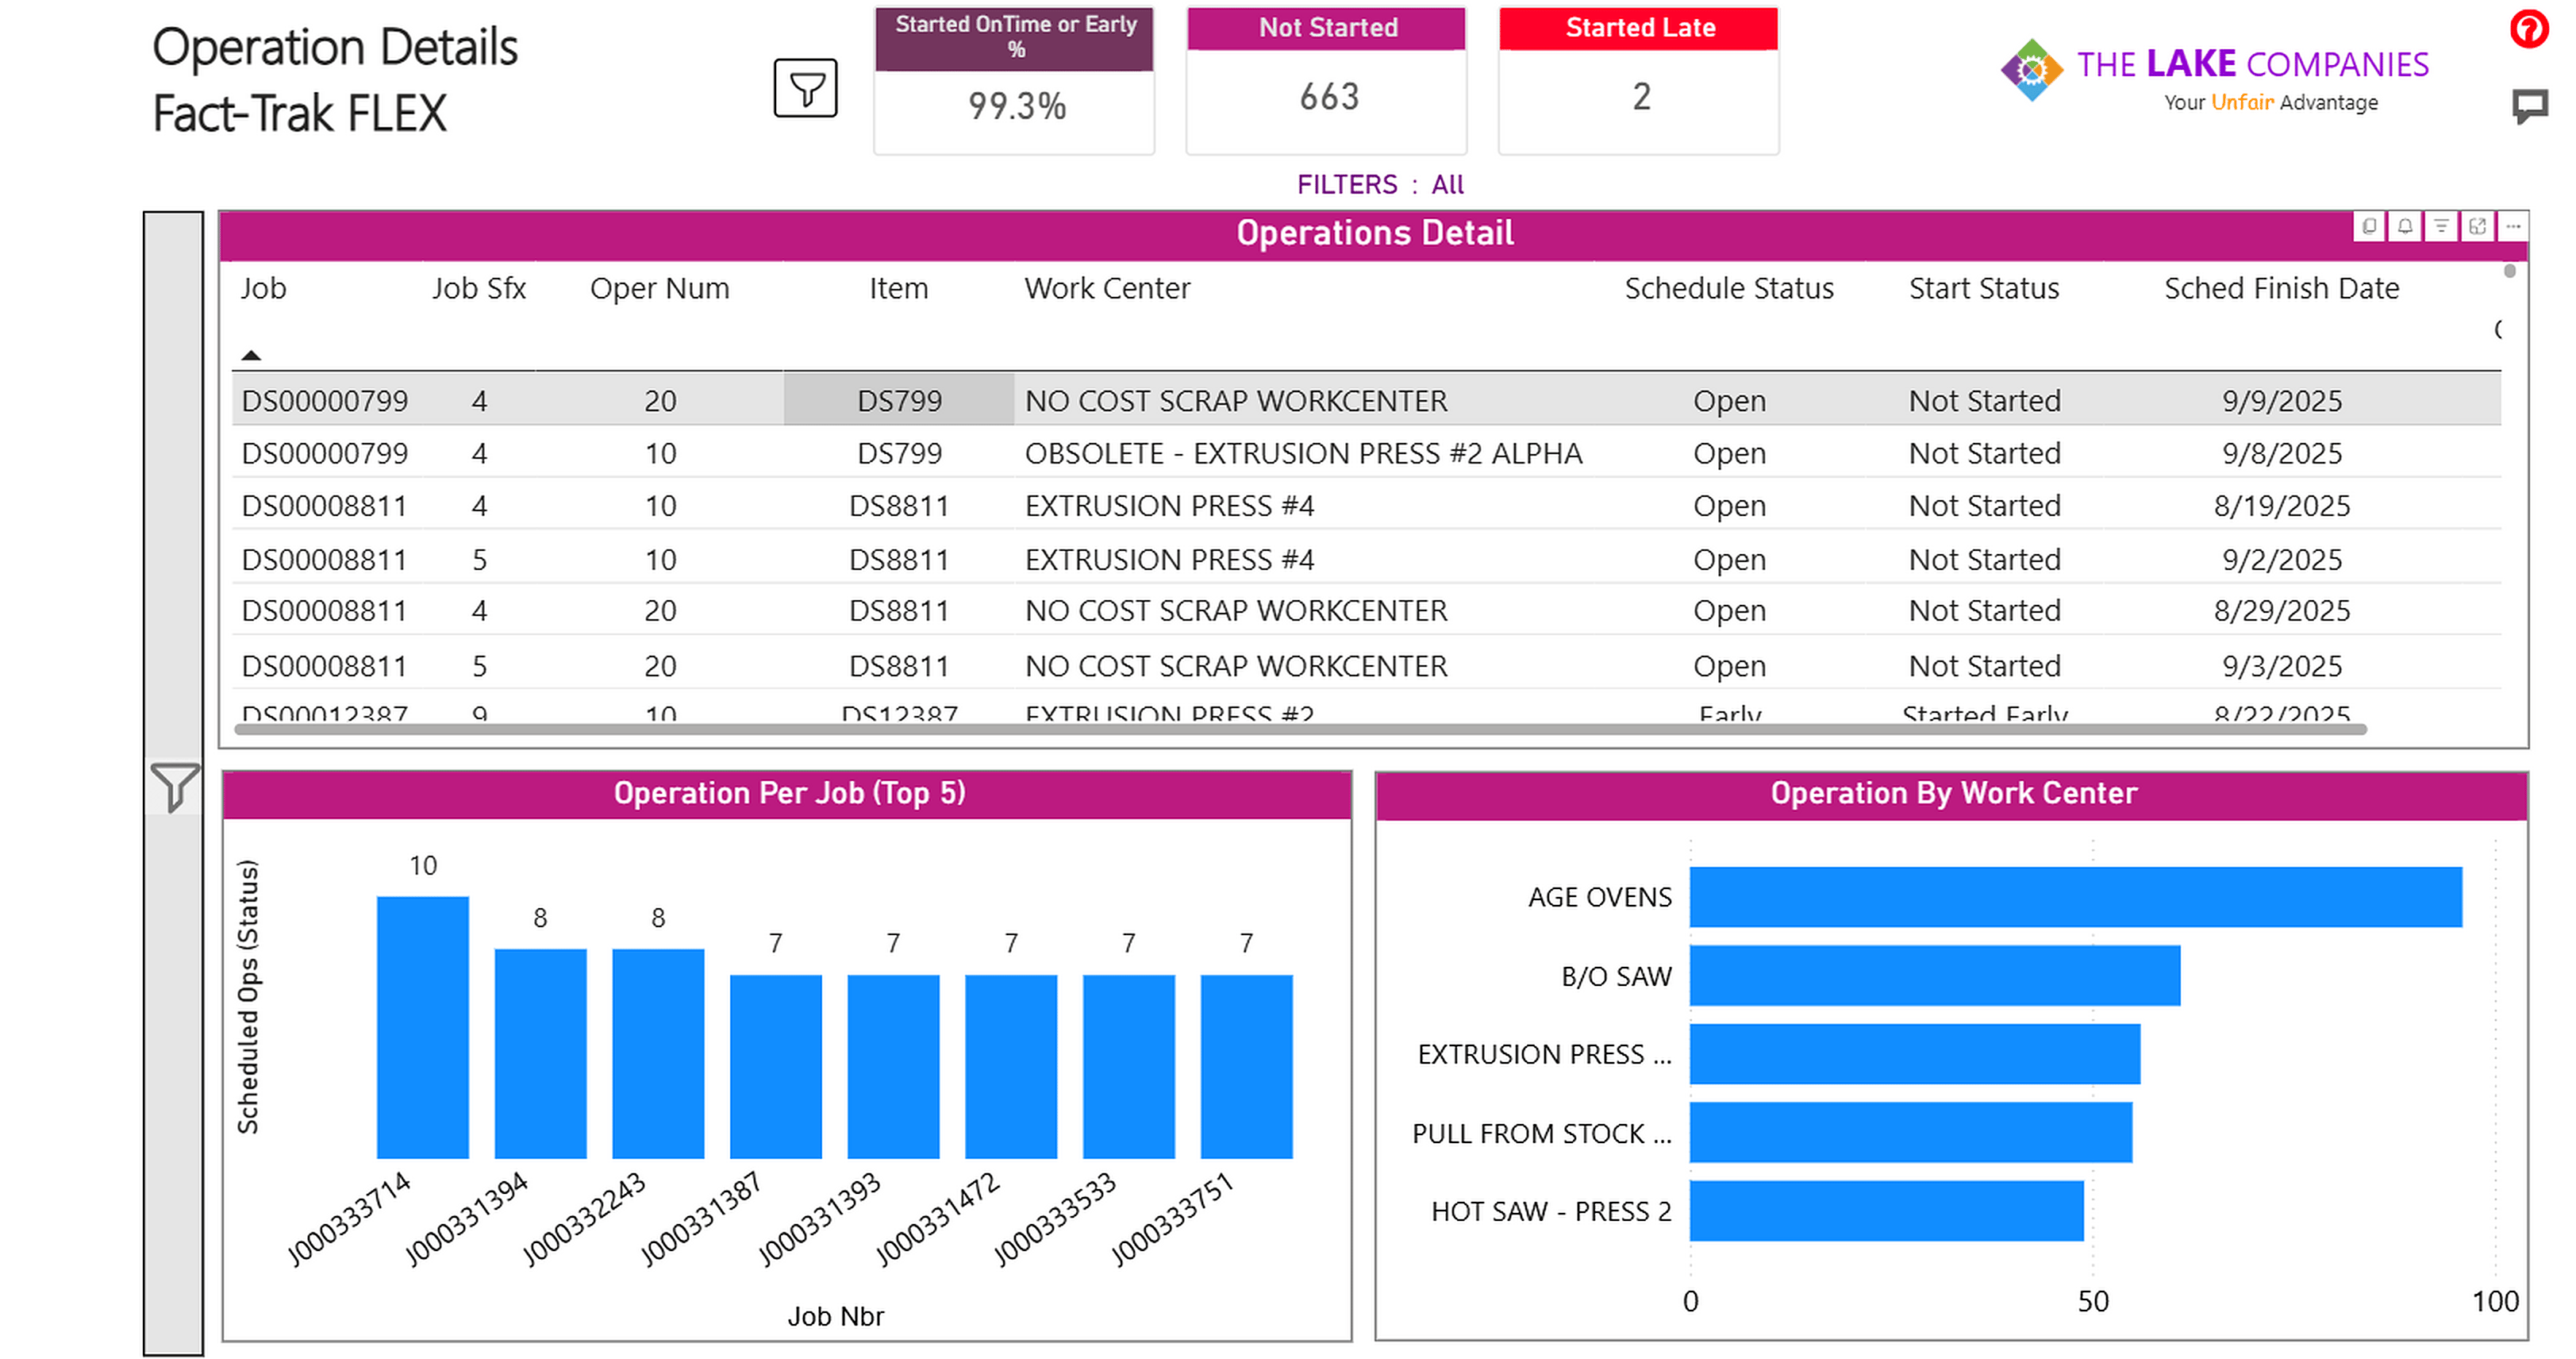
Drill from the summary into the job and operation level to see exactly what started on time, what started late, and what hasn't started at all.
That's the difference between a KPI you talk about and one you actually manage. Execution to plan improves because you can finally watch it day to day. Root causes surface instead of hiding: unrealistic routing times, jobs released without materials, priorities that aren't being followed, overloaded capacity. Planning quality improves, because you can validate whether your plans were ever feasible in the first place. And trust in the plan grows, because a schedule people can see themselves hitting is a schedule they believe in.
The bottom line
Schedule adherence has always been the number everyone chases. The reason so few shops ever caught it wasn't a lack of will. It was that getting to it was too hard. Fact-Trak closes that gap. The number you've always wanted is finally one you can simply open up and use.
See it in action or talk to your Lake rep.
Related: What Your Schedule Adherence Is Really Telling You — the thought-leadership piece this builds on.